
A Clear Guide to the Gum Measurements Taken at the Dentist
Pocket depth gains context from bleeding, recession, attachment level, imaging, risk factors and changes over time—not one number alone.
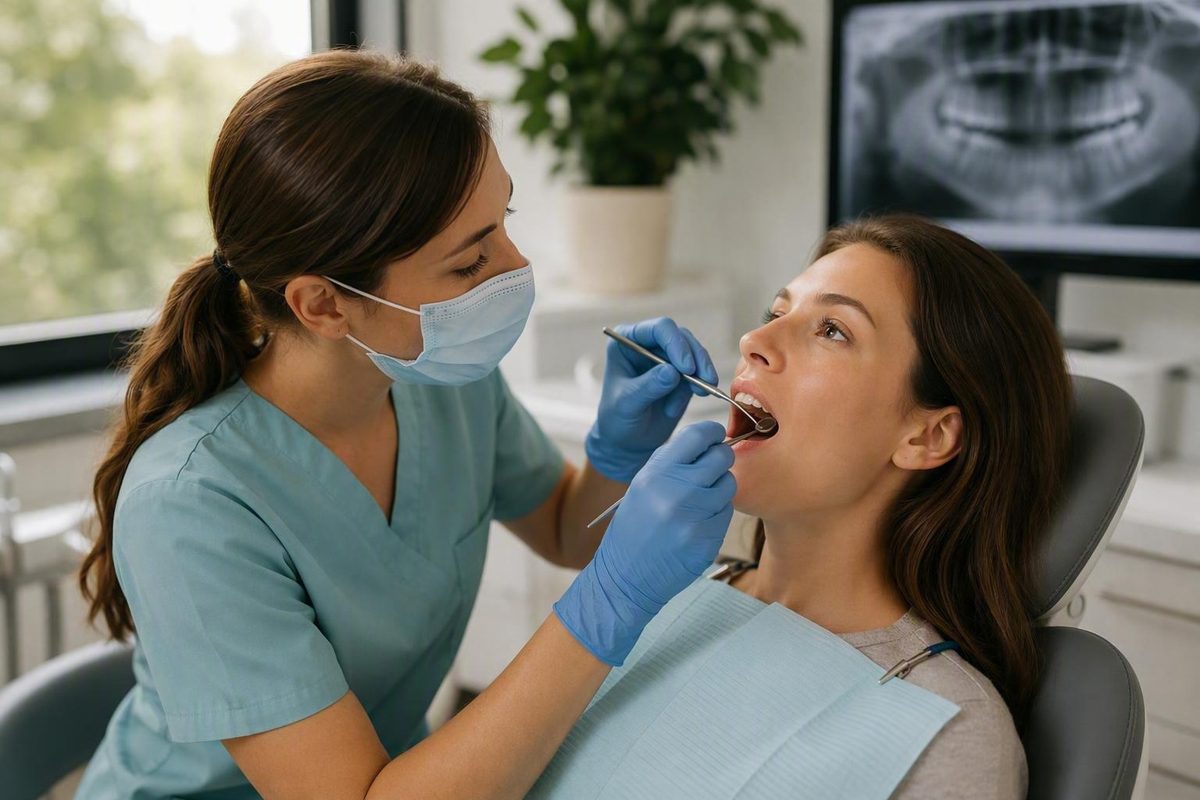
If you have heard a dentist or dental hygienist call out “three, two, four” while moving a small instrument around your teeth, those numbers were probably part of periodontal charting. They commonly describe gum-pocket depths in millimetres, but depth is only one part of the record.
A periodontal chart is best understood as a site-by-site map, not a pass-or-fail score. It shows where particular findings occur and creates a baseline for comparison with later examinations. Dental professionals interpret the measurements alongside bleeding, recession, attachment level, mobility, furcation findings, imaging, risk factors, and changes over time. One pocket-depth number does not settle a diagnosis.
The depth categories discussed below are cautious summaries of patient-education sources, not formal diagnostic thresholds or a substitute for professional periodontal guidance.
What periodontal charting records—and why dentists use it
Periodontal charting is the systematic measurement and recording of findings around the tissues supporting the teeth.
The familiar numbers called aloud usually represent probing depths. A dentist or dental hygienist measures the distance from the visible gingival—or gum—margin to the base of the space reached by a periodontal probe. The result is recorded in millimetres.
It helps to distinguish three related ideas:
- Periodontal probing is the examination used to gather site-level measurements and observations.
- The periodontal chart is the organized record of those findings.
- Clinical assessment is the professional interpretation of the chart alongside the wider examination, history, and any relevant imaging.
A chart can show whether deeper readings are isolated or widespread, whether bleeding occurs around particular teeth, and whether recession affects one surface more than another. It can establish a baseline, identify sites requiring closer evaluation, and support comparisons over time.
These functions matter because periodontal problems can develop with few noticeable symptoms. A person cannot infer the condition of the supporting tissues from pain or appearance alone. Conversely, redness, tenderness, or bleeding cannot be classified accurately from appearance alone. Charting adds structured evidence, but it does not turn one measurement into a diagnosis.
What happens during the examination
The examiner uses a periodontal probe: a slender instrument marked in millimetres. It is gently placed between the tooth and gum to measure the probeable sulcus or pocket. Although the instrument may look pointed, patient guidance describes it as a small measuring tool with a dull end rather than an instrument designed to cut gum tissue. Waterpik describes the basic probing sequence and instrument.
Comprehensive charting commonly records six sites per tooth:
- Mesial, middle, and distal positions on the cheek- or lip-facing surface
- Mesial, middle, and distal positions on the tongue- or palate-facing surface
“Mesial” generally means toward the centre line of the dental arch, while “distal” means away from it. In patient-facing language, the pattern is often described as the front corner, middle, and back corner on each side of the tooth.
Six sites are commonly used because findings can vary around one tooth. A molar may have one reading on its cheek-facing middle surface and a different reading between it and the neighbouring tooth. One measurement would not preserve that site-level difference.
If 28 adult teeth are charted at six sites each, the examination can produce up to 168 probing-depth entries. Missing teeth, implants, wisdom teeth, and the purpose of the examination can change the actual total. A periodontist-authored explanation describes both the six-site pattern and the 168-entry maximum.
Recording workflows vary. The examiner may:
- Enter each finding directly into software;
- Call measurements to an assistant;
- Use voice-recognition software;
- Record findings on paper for later entry.
Many people experience pressure or little discomfort during gentle probing, while inflamed areas may be tender and can bleed. A clinical patient guide similarly notes that comfort can vary with tissue condition. Its description of full periodontal charting addresses both six-site recording and probing comfort.
Bleeding after probing should not automatically be interpreted as proof that the instrument injured otherwise healthy tissue. It is a clinical sign recorded for interpretation in context. It also does not, by itself, establish a particular diagnosis or severity.
How to read the main fields on a periodontal chart
A detailed periodontal chart contains several kinds of information. Some values are measured directly, some may be calculated from measured landmarks, and others are site observations or summary percentages.
Probing depth
Probing depth is the measured distance from the gingival margin to the base of the probeable sulcus or pocket. It is usually the number being called out during the examination.
The measurement describes the depth of that space at that site. By itself, it does not establish how much attachment or supporting bone has been lost.
Gingival-margin position and recession
The gingival-margin position records where the visible gum edge sits relative to a reference point on the tooth. A commonly used reference is the cementoenamel junction, or CEJ—the boundary between the crown’s enamel and the root’s cementum.
When the gum margin has moved toward the root, this is generally described as recession. Recession may expose part of the root or make the tooth appear longer. It can coexist with a shallow probing depth, which is one reason pocket depth alone may not describe the entire relationship between the gum and tooth.
Clinical attachment level
Clinical attachment level, or CAL, relates the base of the pocket to a comparatively fixed landmark such as the CEJ. This is different from probing depth, which begins at the current gum margin.
Consider a carefully bounded example. If the gum margin is 4 mm apical to the CEJ and the probing depth is 3 mm, the distance from the CEJ to the pocket base is approximately 7 mm:
3 mm probing depth + 4 mm recession ≈ 7 mm clinical attachment level
That addition applies to the stated configuration, where the gum margin is apical to the CEJ. It should not be applied unchanged when the gum margin covers the CEJ or when a chart uses a different sign convention. The gingival-margin position must be encoded correctly before software calculates attachment level. A charting interface that separates entered probing depth and gingival-margin measurements from calculated attachment level illustrates this distinction. See the periodontal chart’s measurement and calculation fields.
Bleeding on probing
Bleeding on probing, often abbreviated BOP, records whether a site bleeds after gentle probing. Dental professionals use its presence and distribution when assessing inflammation.
BOP is not a diagnosis by itself. Its significance depends on the wider pattern, including probing depth, plaque, recession, attachment findings, tissue condition, and previous records.
Plaque
Plaque may be marked at individual sites. Software can then summarize those marks as a percentage.
The site-level record shows where plaque was observed; the percentage compresses that distribution into an overall figure. Because charting systems may use different indices or configurations, a displayed plaque percentage should not be assumed to follow one universal formula.
Mobility
Mobility records detectable looseness or movement of a tooth. Some forms record one mobility value per tooth rather than a separate value at all six sites.
Mobility is distinct from probing depth. Its presence warrants professional interpretation, but the chart entry alone does not establish its cause.
Furcation involvement
A furcation is the area where the roots of a multirooted tooth divide. Furcation involvement records findings in that root-division area and therefore applies only to teeth with the relevant root anatomy.
Like mobility, it adds information that a list of probing depths cannot capture. Its location and extent must be considered with the rest of the examination.
Other possible fields
Depending on the examination and charting system, the record may also include:
- Suppuration or pus;
- Gingival appearance or condition;
- Calculus;
- Keratinised-tissue width;
- Mucogingival findings;
- Recession classifications;
- Missing teeth;
- Tooth or implant notation;
- Visible CEJ or root-surface features;
- Relevant health and risk information.
The practical distinction is:
- Measured values: probing depth and gingival-margin position, generally recorded in millimetres;
- Calculated values: potentially clinical attachment level;
- Site observations: bleeding, plaque, suppuration, and some furcation findings;
- Tooth-level observations: often mobility and certain anatomical findings;
- Summaries: average depth, deepest depth, or percentages of sites marked for bleeding or plaque.
Summaries make a complex chart easier to scan, but they can conceal distribution. Two people may have the same average depth while one has relatively even readings and the other has mostly shallow readings with a small number of deeper sites.
What common probing-depth ranges can—and cannot—tell you
Depth ranges are useful as general screening signals, not diagnostic thresholds or automatic treatment rules. Interpretation also depends on bleeding, inflammation, recession, clinical attachment level, imaging, distribution, and changes over time.
Patient-education sources use inconsistent labels. Waterpik describes 4 mm as “borderline,” while some dental-practice articles label similar readings as gingivitis, mild disease, or a warning zone. Sources also vary in how strongly they associate 5–6 mm readings with periodontitis and bone loss. This disagreement supports using cautious, conditional language rather than treating any one table as a diagnostic key.
| Depth range | Cautious general interpretation | Contextual findings to check | What depth alone cannot establish |
|---|---|---|---|
| 1–3 mm | Often compatible with periodontal health when bleeding, inflammation, and attachment loss are absent or minimal. A clinical overview applies these qualifications to the 1–3 mm range. | Bleeding, recession, attachment level, plaque, tissue condition, and previous charts | That the site is healthy in every respect |
| 4 mm | A contextual or warning-zone finding that warrants evaluation rather than an automatic disease label. Commercial patient guidance explicitly calls 4 mm “borderline” and describes its categories as generalizations. | Bleeding, gum enlargement, recession, attachment level, deposits, and previous readings | Gingivitis, periodontitis, bone loss, severity, or a required treatment |
| 5–6 mm | May be associated with periodontitis, particularly when other findings indicate loss of support. A periodontal charting overview qualifies this range by bleeding, attachment loss, and radiographic findings. | Bleeding, documented attachment loss, radiographic findings, mobility, furcation findings, distribution, and trend | That bone loss is definitely present or that a particular procedure is required |
| 7 mm or more | May occur with substantial attachment loss or advanced periodontal destruction and warrants careful professional assessment. A periodontist-authored patient guide presents this as a possible—not self-sufficient—interpretation. | The full chart, supporting tissues, mobility, furcation findings, history, risk factors, and relevant imaging | A complete diagnosis, formal stage, prognosis, or treatment plan |
In practical terms:
- A 1–3 mm site can be reassuring when it does not bleed and no meaningful recession or attachment loss is documented. It is not proof of perfect health.
- A 4 mm site requires context. The number alone cannot identify its cause or establish disease.
- A 5–6 mm site may be more concerning, especially when accompanied by bleeding, attachment loss, or radiographic changes. Depth alone does not prove those accompanying findings.
- A 7 mm or deeper reading can occur where periodontal destruction is substantial, but the complete clinical picture remains necessary.
These ranges should not be converted into automatic treatment instructions. A chart records findings; it does not select care by matching one depth to one procedure.
Why the same pocket depth can mean different things
Imagine two sites that both measure 4 mm.
At the first site, there is no bleeding and no documented attachment loss or concerning change from earlier charts. At the second, probing produces bleeding and the record documents attachment loss. The second combination is more concerning because several findings point in the same direction. The shared depth does not make the sites clinically equivalent.
Now compare two sites that both measure 3 mm. One has no recession. The other has 4 mm of recession, with the gum margin apical to the CEJ. Their probing depths are identical, but the second site has a greater distance from the CEJ to the pocket base. Clinical attachment level therefore provides information that probing depth alone does not show.
The current position of the gum margin also affects what a probing-depth number represents. Determining the explanation at an individual site requires professional assessment.
Other findings considered alongside depth may include:
- Plaque and calculus;
- Bleeding or suppuration;
- Gingival condition;
- Recession and attachment level;
- Tooth mobility;
- Furcation involvement;
- Dental and medical history;
- Smoking and diabetes;
- Previous periodontal disease;
- Relevant imaging;
- Changes across examinations.
The chart and any imaging contribute different findings to the broader assessment; neither should be treated as a universal substitute for the other. The clinician considers them together where appropriate.
It is also useful to separate three concepts:
- Finding: A recorded observation, such as a 5 mm probing depth, bleeding at one site, or 2 mm of recession.
- Diagnosis: The clinician’s integrated conclusion based on the examination, chart, history, and other relevant evidence.
- Severity and complexity assessment: A broader judgment about the extent and implications of the condition.
Why previous charts matter more than an isolated number
The first comprehensive chart creates a baseline. At later examinations, the dental team can compare corresponding sites rather than relying on memory or a general impression that the gums look better or worse.
Changes that may be reviewed include:
- Probing depth at corresponding sites;
- Number and distribution of deeper readings;
- Bleeding patterns;
- Gingival-margin position and recession;
- Clinical attachment level;
- Plaque distribution or percentage;
- Tooth mobility;
- Furcation findings;
- Suppuration or other recorded signs.
Patterns across multiple sites and visits are generally more informative than one isolated reading. A cluster of sites that becomes deeper while also showing more bleeding or attachment loss presents a different pattern from a single small change with otherwise stable findings.
A small difference should not automatically be labelled progression or improvement. The supplied patient-education sources do not establish one universal threshold that separates clinically meaningful change from ordinary variation in every setting. The appropriate interpretation depends on the complete record and examination.
A pocket may also become shallower after inflammation settles. That can be favourable, but a lower probing depth does not by itself prove that previously lost attachment or bone has regenerated. The clinician must interpret the change alongside recession, attachment level, bleeding, tissue condition, treatment history, and any other relevant findings.
Digital systems may make comparison easier by displaying previous examinations or allowing selected earlier entries to be copied into a new chart. A previous value should not automatically become today’s finding.
Useful questions to ask when reviewing a chart include:
- Which exact sites changed?
- Did those sites bleed during probing?
- Has the gum margin or recession changed?
- Is clinical attachment loss documented?
- Are deeper readings isolated or widespread?
- Do other examination findings support the interpretation?
- How does this chart compare with more than one previous examination?
These questions move the conversation away from “Is a 4 bad?” and toward “What does this measurement mean within my overall pattern?”
Screening, full charting, and how often measurements are repeated
A periodontal screening is not necessarily the same as comprehensive full-mouth charting.
A screening method such as Periodontal Screening and Recording (PSR) may use selected measurements and summary codes to identify whether a more comprehensive examination is indicated. Spot probing likewise examines selected areas rather than recording six sites around every tooth.
Comprehensive charting ordinarily records six sites per tooth and may include bleeding, gingival-margin position, attachment level, mobility, furcations, plaque, suppuration, and other findings. Screening can efficiently identify a need for further assessment, but it should not be treated as a universal replacement when comprehensive charting is indicated. A professional trade-publication discussion describes PSR as a screening protocol rather than a replacement for comprehensive charting. It also stresses that documentation expectations vary.
There is no single interval consistently supported by the supplied patient-education sources. Colgate recommends charting at least annually, while another dental-practice article recommends twice-yearly charting. These are general recommendations, not proof of a universal clinical or legal rule. Colgate’s patient guide gives the annual recommendation, while DeLeon Family Dental presents the twice-yearly recommendation.
A risk-based schedule may consider:
- Current periodontal findings;
- Previous periodontitis;
- Recent treatment or periodontal-maintenance status;
- New symptoms;
- Smoking;
- Diabetes;
- Changes in recession, mobility, or bleeding;
- Other individual medical or dental considerations.
Someone with stable findings and no identified risk may be assessed on a different schedule from someone under active periodontal care or with a history of periodontitis. A targeted interim check may also serve a different purpose from a new comprehensive chart.
Legal documentation requirements and professional standards vary by jurisdiction and can change over time. Dental professionals must follow the rules and accepted standards applicable to their location and role. Patients should ask why a particular interval is appropriate for them rather than adopting an annual or twice-yearly schedule from a general article.
Paper charts, digital records, and what software features actually mean
A practical paper chart needs enough space to preserve site-level information. A useful form may provide six sites per tooth on both arches, with rows or symbols for:
- Probing depth;
- Bleeding on probing;
- Gingival-margin position or recession;
- Plaque;
- Mobility;
- Furcation involvement.
It may also include fields for missing teeth, implants, suppuration, tissue findings, and examination dates. A blank form is only a recording structure; it is not a substitute for trained measurement or clinical interpretation.
Digital charting can streamline a data-heavy examination. Depending on the system, available functions may include:
- Automatic movement to the next site;
- Direct or assistant-entered data;
- Voice-assisted workflows;
- Configurable probing sequences;
- Universal or FDI tooth numbering;
- Tooth and implant notation;
- Previous-chart comparison;
- Calculated attachment levels;
- Bleeding and plaque percentages;
- Printing and PDF export;
- Data import and export.
These functions describe convenience, not proven clinical quality. A polished display does not establish that calculations are accurate, data are secure, the product improves outcomes, or the system meets every applicable regulatory requirement.
It is also important to distinguish raw data from summaries:
- Raw chart data identify the tooth, surface, site, measurement, and associated observations.
- Calculated site values may include clinical attachment level.
- Summary metrics may include mean depth, deepest depth, bleeding percentage, plaque percentage, or the proportion of sites meeting a selected depth.
Summary metrics help users scan a large chart, but the underlying distribution remains important. An average cannot show whether deeper findings are concentrated around one molar or distributed throughout the mouth.
When evaluating a paper or digital system, useful questions include:
- Does it support six sites per tooth?
- Can it distinguish teeth, implants, and missing teeth?
- Does it represent gingival-margin position on either side of the CEJ?
- Can users identify who entered or changed information?
- Are staff access permissions appropriate?
- What retention and backup arrangements apply?
- Who owns and controls the data?
- Which export formats are available?
- Can records be transferred without losing site-level detail?
- Does the system work with the practice’s main patient record?
- Which privacy, security, and recordkeeping rules apply locally?
- Has calculation accuracy or usability been independently evaluated?
Vendor privacy statements should be treated as vendor claims. For example, Zermmi states that its no-login chart operates in the browser, does not send entered chart data to its servers, and clears the chart when the page is closed or reloaded. Those statements appear on the vendor’s periodontal-charting page. The supplied evidence does not independently verify the tool’s privacy, security, calculations, regulatory status, or clinical accuracy.
When symptoms or chart findings deserve professional assessment
Consider arranging a dental assessment if you notice persistent gum bleeding, redness or swelling, recession, visible roots or longer-looking teeth, persistent bad breath, pus, loose or shifting teeth, tenderness, or a change in how your teeth meet. These symptoms are included across dental patient guidance as reasons to seek professional evaluation. A clinical overview lists persistent bleeding, swelling, recession, looseness, tenderness, and bad breath among the relevant signs.
The absence of pain does not rule out a periodontal problem. Increasing measurements, repeatedly deep sites, or recurring bleeding also require interpretation alongside the rest of the examination.
Self-probing at home is not advisable. Patient guidance specifically cautions that accurate self-measurement is not appropriate without professional training and instruments. The same clinical source addresses why pocket measurement belongs with a dental professional.
Home plaque control and clinical diagnosis are separate tasks.
The central idea is simple: a periodontal chart is a map, not a score. Its numbers are useful because they locate findings and create a record for comparison—not because one depth settles the diagnosis. When discussing your chart, ask how the measurements relate to bleeding, recession, attachment level, other examination findings, risk factors, and earlier records.
Decay Guide is an independent information publisher, not a dental practice. This article provides general reference information. It cannot diagnose your gums, choose treatment, or replace an examination by a qualified dental professional.
Does periodontal charting hurt or damage the gums?
Most people experience pressure or little discomfort during gentle periodontal probing. Inflamed or tender areas may be more sensitive and can bleed.
Bleeding does not automatically mean that the probe damaged otherwise healthy tissue. It is recorded as a clinical sign that may contribute to assessment of inflammation, but it is not a diagnosis by itself. Tell the examiner if an area is painful so that they can respond appropriately.
Is a 4 mm periodontal pocket always gum disease?
No. A 4 mm reading is best treated as a contextual or warning-zone finding, not an automatic disease label.
The clinician considers whether the site bleeds, whether the gum margin has changed, whether attachment loss is documented, what other examination findings show, and whether the reading is stable or changing. Two sites with the same depth may therefore receive different interpretations.
Why do gums sometimes bleed during periodontal probing?
Inflamed gum tissue may bleed after gentle probing. Dental professionals record the presence and distribution of that bleeding as part of the periodontal assessment.
Bleeding on probing does not by itself identify the cause, establish periodontitis, quantify lost support, or determine treatment. Probing depth, plaque, tissue condition, recession, attachment level, history, and other findings also matter.
How often should periodontal charting be done?
There is no universal interval that applies to everyone. The supplied patient guidance ranges from twice yearly to at least annually, while professional commentary also discusses annual comprehensive charting for regular adult patients. None of these secondary sources establishes a universal requirement.
Appropriate timing may depend on current findings, previous periodontitis, symptoms, smoking, diabetes, recent treatment, maintenance status, and other individual considerations. Screening or targeted checks may also occur between comprehensive charts. Ask your dentist or dental hygienist what interval they recommend for you and why.
Can I measure my own periodontal pockets at home?
Accurate self-measurement is not advisable. Periodontal probing requires training, a calibrated instrument, controlled technique, consistent site placement, and an understanding of recession, gum-margin position, bleeding, and attachment landmarks.
Even a correctly read depth would not provide a diagnosis without the rest of the examination and, where appropriate, imaging. Brushing and interdental cleaning remain useful for plaque control, but evaluation of pocket depth and periodontal support belongs with a qualified dental professional.